MSCI vs FTSE: What is the difference between the two? G.R. Krahmer
Brand awareness counts, and this applies just as much to the stock markets of London, New York, Paris and Milan as it does to the fashion houses. When ETF managers partner their products with an index provider, it is proof that they are choosing the big name. Look at the critical category of the developed world.
The MSCI World index completely dominates the field: with 19 MSCI World ETFs (as of June 2023) versus two FTSE Developed World ETFs (excluding factor or sector tilts). MSCI is also the leading index provider in emerging markets: 15 vs 2 vs FTSE for vanilla ETFs. Only when you go deeper into regions and countries do other index providers such as STOXX, S&P and even FTSE play an important role. Despite MSCI ‘s global dominance, there is little obvious difference between their offering and that of FTSE: both offer broadly diversified, market capitalization-weighted indices. But it’s all in the details, and you can only make that clear by diving deep into the index ways of the two providers.
MSCI versus FTSE: the differences
The biggest difference between the two index providers is whether they consider certain countries to be developed or emerging markets. For example, South Korea is classified as an emerging country by MSCI, but is promoted to developed market status by FTSE. Therefore, South Korea is included in the FTSE developed market index but not in the emerging market index, and vice versa for MSCI. Meanwhile, Poland was upgraded to developed-market status by FTSE in 2018, while MSCI is still unconvinced – leaving Poland in emerging-market competition for now.
Another difference can be seen in the way Chinese stocks are handled: since June 2018, MSCI has included A-shares in its emerging markets index, alongside H- and B-shares, which for a long time were only accessible to Chinese investors. The inclusion amounts to 20 percent of the market capitalization and is limited to stocks that can be bought by foreign investors.
FTSE also included Chinese A-shares in its emerging markets index at a share of market capitalization in June 2019 and has since increased this share to 25 percent of market capitalization. This makes China by far the most represented country in both emerging markets barometers, although no more than a quarter of the actual market capitalization of Chinese domestic equities is counted for this purpose.
MSCI versus FTSE: Individual weighting by country by index

To land
America Japan
Great Britain France Canada
To land
China Taiwan
India South-Korea Brazil
MSCI World
68,92% 6,28% 4,12% 3,42% 3,2%
MSCI EM
29,2% 16,18% 14,34% 12,78%
5,15%
FTSE developed
66,70% 7,10% 4,43% 3,23% 3,74%
FTSE EM
32,46% 17,85% 17,63%
– 6,07%
MSCI versus FTSE: Individual country weighting by index
The contrast in index composition is more evident in emerging markets, as South Korea makes a big difference at this level. It is the fourth-largest country in the MSCI Emerging Markets Index and therefore its absence from the FTSE index tends to concentrate its positions in the other major players. Small-cap companies cause another substantial difference between the indices. The MSCI global indices cover 85% of the investible universe, measured by market capitalization, and exclude the bottom 15% as small-cap companies. But the global FTSE indices track 90% of the market cap and exclude the bottom 10% as small companies. Essentially, FTSE is picking up a number of companies that MSCI likes small-cap defines, which explains why FTSE indices tend to contain more companies.
MSCI vs FTSE: Number of Shares per Index
Region
The whole world Developed markets Emerging markets Europe

Japan
MSCI FTSE
2.888 4.164 1.509 2.148 1.379 2.016
428 594 237 520
More companies are included in the FTSE indices, due to their relatively small size they have little impact.
MSCI versus FTSE:
The performance difference between the MSCI World in of FTSE Developed-indices was negligible, as you can see in this comparison of popular ETFs tracking the two.
Performance Comparison: MSCI vs. FTSE – Developed Markets
THE Vanguard FTSE developed world UCITS ETF THE iShares MSCI World UCITS ETF (Dist)
13/06/2023
Bron: FTSE, MSCI; from
You can hardly find a sheet of paper between the results of Vanguard’s FTSE Developed World ETF in iShares MSCI World ETF let it slide, because the differences in index composition are not enough to
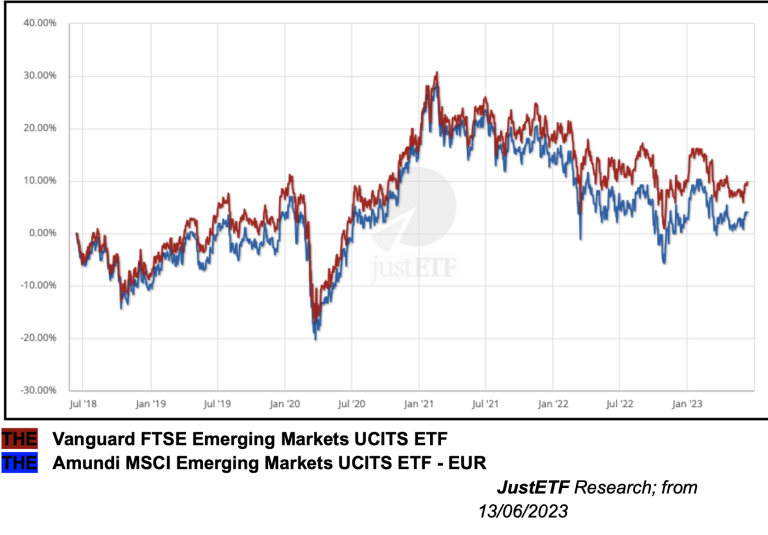
the needle to move noticeably. But the same is not true for emerging markets. Since its launch, the Vanguard FTSE Emerging Markets ETF (+56.75%) outperformed the iShares ETF MSCI Emerging Markets ETF (+48.75%). There is, of course, no reason to believe that the FTSE advantage will last in the long term. MSCI could revise FTSE if future performance favors the composition of the emerging markets index. For example, if South Korea outperformed other investments in its index.
MSCI vs. FTSE – Emerging Markets (12/06/2018 – 12/06/2023)
THE Vanguard FTSE Emerging Markets UCITS ETF THE Amundi MSCI Emerging Markets UCITS ETF – EUR
JustETF Research; from 13/06/2023
Small deviations in the index structure can make a bigger difference at a regional or national level. This is where it can pay to pay close attention to different index methodologies. For example, how much exposure to small caps do you get? What mix of share classes is a Chinese ETF exposed to? Do you follow a total stock market that makes it less likely that your ETF will be saddled with transaction costs due to the companies’ turnover?
What does that mean in concrete terms?
The broader the index, the more likely it is to deliver similar results to its peers over the medium and long term. And you can’t get broader than a global ETF, so focus here on the cost of the product rather than the finer details of index construction. But: the cheapest MSCI World ETF currently has a Total Expense Ratio (TO HAVE) of 0.12%. That is exactly the same TER as that of the two FTSE Developed ETF’s. The cheapest MSCI Emerging Markets ETF, on the other hand, costs 0.14%, while the FTSE Emerging ETF 0.22% cost.
The situation is reversed for All-World products that combine developed and emerging markets in one index. The FTSE All-World ETF costs 0.22% versus 0.20% for the cheapest MSCI All-Country World ETF. That makes a difference of 0.02%. However, try to avoid mixing index providers into your portfolio at the broad market level. For example, if you have a MSCI World ETF combines with a FTSE Emerging ETF, you don’t have any exposure to South Korea or
Poland. Meanwhile, you own both markets twice if you use the FTSE Developed World ETF along with a MSCI Emerging Markets ETF takes.


Sector
MSCI World 1.506
23
85% of the global market
17 ETFs 0.12% – 0.50%
USA (68.92%) Japan (6.28%) UK (4.12%) France (3.42%) Canada (3.2%)
FTSE Developed 2.148
25
90% of the global market
1 ETF 0.12%
USA (66.7%) Japan (7.1%) UK (4.43%) France ( 2.35%) Canada (2.74%)
MSCI World Index tegen FTSE Developed Index
| Number of holdings |
| Number of countries |
| Coverage |
| ETFs available |
| Total Expense Ratio ETFs (TER) |
| 5 largest countries |
| 5 largest sectors |
| 5 largest companies |
Technology (24.42%)
Healthcare (13.17%)
Finance (12.7%)
Consumer Discretionary (10.73%)
Industry (10.37%)
Apple (5.26%)
Microsoft (4.34%)
Amazon (2.07%) Nvidia (1.74%)
Alphabet A (1.37%)
Source: MSCI World, FTSE Developed; as of 13/06/2023
Technology (24.65%) Healthcare (12.67%)
Industrial Goods and Services (12.13%)
Banks (5.46%) Retail Trade (4.93%)
Apple (4.88%) Microsoft (4.5%) Amazon (1.96%) Nvidia (1.64%) Alphabet A (1.35%)
MSCI vs. FTSE: which is the best index provider?
The question of which of the two stock indices is better is often discussed. While the MSCI All Country World Index (MSCI ACWI Short) covers approximately 85 % of the world’s market capitalization, the FTSE the whole world controls about 90%. Both indices invest and focus on equities from both developed and emerging markets large-and mid-caps. Both indices are ideally suited and a perfect “all-in-one” solution for those who only want to have one ETF in their trading account or who are just starting out with ETFs.
Which ETF is better than the MSCI World?
There is no such thing as ‘better’ or ‘worse’ in the true sense of the word. It should just not be noted that the MSCI World is not a completely comprehensive world index, because the more than twenty emerging markets around China, India, etc., are missing from the MSCI World. So if you really want to invest globally, you should choose an emerging markets index or go for a globally diversified index such as the MSCI ACWI of FTSE All-World. The last two countries include both industrialized countries and emerging countries.
How good is the Vanguard FTSE All World?
ETFs on the FTSE All World Index are an excellent way to invest globally in a diversified way. Even though the people in this country know MSCI of iShares better than FTSE in Vanguard, there is nothing to be said against betting on the counterpart of the MSCI ACWI, of FTSE All World.
Which ETF is the most broadly diversified?
Contrary to what you might think, it is not the well-known one MSCI World which is the most broadly diversified in the stock market. This is because the MSCI World only contains stocks from industrialized countries such as the US or Japan. On the other hand, if you prefer the broadest possible diversification, choose global indices of industrialized and emerging countries such as the MSCI ACWI or the FTSE All World. This covers approximately 90% of the market capitalization. If you want it even wider, you have to smallcaps add to the large in mid-caps. These are included in the MSCI ACWI IMI. The counterpart of this index is the FTSE Global All Cap, mentioned, but there is only ESG Sustainable by.
Conclusion:
The goal of asset allocation is to combine assets so that they can withstand market shocks and achieve the growth they need. Understanding the function of each class is the first step in creating an asset allocation. When it comes to diversification, equities are the driving force behind long-term growth. Additionally, you can expect stocks to provide better returns than other types of investments as the economy recovers. During recessions, high-quality government bonds are often a safe haven. Commodities were a good hedge portfolio during economic chaos. The crisis and currency devaluation between 2008 and 2009 made gold popular.
Both indices invest in virtually the same shares and as a result achieve similar returns. The index contains approximately 9,000 different shares. Ultimately, it is a choice between apples and oranges. If you prefer pears, go for pears, and if you like apples, go for apples. Furthermore, both indices prioritize sector diversification, ensuring well-rounded representation across sectors. This approach promotes portfolio diversification and limits the risk of overexposure to specific sectors. So you go for the MSCI AND IMI or do you go for the FTSE Global All Cap. I’m going for the ACWI, but you can go for the FTSE to go. Or I go for ACWI and you go for the FTSE. It makes very little difference, you will see the difference in the long term, but even that wouldn’t be too big.

